|
chr1_+_116455898
|
2.413
|
NM_152367
|
MAB21L3
|
mab-21-like 3 (C. elegans)
|
|
chr3_-_71376919
|
2.196
|
|
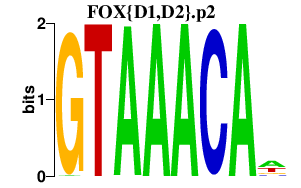
FOXP1
|
forkhead box P1
|
|
chr2_-_192420168
|
1.675
|
NM_004657
|
SDPR
|
serum deprivation response
|
|
chr1_-_159459814
|
1.621
|
|
APOA2
|
apolipoprotein A-II
|
|
chr2_-_233586164
|
1.556
|
NM_019850
|
NGEF
|
neuronal guanine nucleotide exchange factor
|
|
chr4_-_152368492
|
1.522
|
|
SH3D19
|
SH3 domain containing 19
|
|
chr2_-_192419896
|
1.337
|
|
SDPR
|
serum deprivation response
|
|
chr10_+_123912930
|
1.331
|
|
TACC2
|
transforming, acidic coiled-coil containing protein 2
|
|
chr10_+_123913094
|
1.274
|
NM_006997
NM_206860
|
TACC2
|
transforming, acidic coiled-coil containing protein 2
|
|
chr17_-_61655915
|
1.268
|
NM_000042
|
APOH
|
apolipoprotein H (beta-2-glycoprotein I)
|
|
chr13_+_112825113
|
1.238
|
NM_000504
|
F10
|
coagulation factor X
|
|
chr3_-_126088530
|
1.233
|
|
ITGB5
|
integrin, beta 5
|
|
chr5_-_16795336
|
1.210
|
|
MYO10
|
myosin X
|
|
chr2_-_233586145
|
1.201
|
|
NGEF
|
neuronal guanine nucleotide exchange factor
|
|
chr3_-_71262426
|
1.198
|
|
FOXP1
|
forkhead box P1
|
|
chr2_-_165133239
|
1.197
|
|
GRB14
|
growth factor receptor-bound protein 14
|
|
chr7_+_134114912
|
1.196
|
|
CALD1
|
caldesmon 1
|
|
chr3_+_189413414
|
1.179
|
NM_005578
|
LPP
|
LIM domain containing preferred translocation partner in lipoma
|
|
chr10_-_52315390
|
1.070
|
|
A1CF
|
APOBEC1 complementation factor
|
|
chr10_+_63478974
|
1.067
|
|
ARID5B
|
AT rich interactive domain 5B (MRF1-like)
|
|
chr16_+_52027020
|
1.040
|
|
RBL2
|
retinoblastoma-like 2 (p130)
|
|
chr3_-_71262405
|
1.022
|
|
FOXP1
|
forkhead box P1
|
|
chr20_+_21054623
|
1.022
|
NM_001163022
NM_001163023
NM_018474
|
PLK1S1
|
polo-like kinase 1 substrate 1
|
|
chr11_-_114880275
|
1.013
|
NM_001098517
NM_014333
|
CADM1
|
cell adhesion molecule 1
|
|
chr14_+_22136968
|
1.011
|
NM_022060
|
ABHD4
|
abhydrolase domain containing 4
|
|
chr10_-_101831579
|
1.005
|
NM_001308
|
CPN1
|
carboxypeptidase N, polypeptide 1
|
|
chr10_-_44794146
|
1.005
|
NM_007021
|
C10orf10
|
chromosome 10 open reading frame 10
|
|
chr20_-_42561725
|
0.999
|
|
|
|
|
chr7_+_134114701
|
0.987
|
NM_004342
NM_033138
NM_033157
|
CALD1
|
caldesmon 1
|
|
chr12_+_119900677
|
0.986
|
|
HNF1A
|
HNF1 homeobox A
|
|
chr15_+_97009194
|
0.977
|
|
IGF1R
|
insulin-like growth factor 1 receptor
|
|
chr7_+_134114957
|
0.976
|
|
CALD1
|
caldesmon 1
|
|
chr1_+_227506751
|
0.968
|
NM_006542
|
SPHAR
|
S-phase response (cyclin related)
|
|
chr17_+_56109940
|
0.945
|
NM_001099432
NM_017679
|
BCAS3
|
breast carcinoma amplified sequence 3
|
|
chr1_-_12599934
|
0.936
|
NM_004753
|
DHRS3
|
dehydrogenase/reductase (SDR family) member 3
|
|
chr4_-_141294682
|
0.935
|
NM_018717
|
MAML3
|
mastermind-like 3 (Drosophila)
|
|
chr12_-_9159707
|
0.926
|
|
A2M
|
alpha-2-macroglobulin
|
|
chr14_+_23654307
|
0.926
|
NM_181357
|
DCAF11
|
DDB1 and CUL4 associated factor 11
|
|
chr12_-_9159742
|
0.924
|
|
A2M
|
alpha-2-macroglobulin
|
|
chr19_+_12995782
|
0.919
|
|
NFIX
|
nuclear factor I/X (CCAAT-binding transcription factor)
|
|
chr10_+_24795446
|
0.911
|
|
KIAA1217
|
KIAA1217
|
|
chr15_-_68781662
|
0.907
|
NM_001008224
|
UACA
|
uveal autoantigen with coiled-coil domains and ankyrin repeats
|
|
chrX_-_6156655
|
0.890
|
NM_181332
|
NLGN4X
|
neuroligin 4, X-linked
|
|
chr12_+_99391870
|
0.887
|
|
NR1H4
|
nuclear receptor subfamily 1, group H, member 4
|
|
chr3_-_58497913
|
0.884
|
NM_003500
|
ACOX2
|
acyl-CoA oxidase 2, branched chain
|
|
chr7_+_134483305
|
0.878
|
NM_018295
|
TMEM140
|
transmembrane protein 140
|
|
chr12_-_9159780
|
0.877
|
|
A2M
|
alpha-2-macroglobulin
|
|
chr14_+_23654161
|
0.875
|
|
DCAF11
|
DDB1 and CUL4 associated factor 11
|
|
chr16_+_54070302
|
0.861
|
NM_004530
|
MMP2
|
matrix metallopeptidase 2 (gelatinase A, 72kDa gelatinase, 72kDa type IV collagenase)
|
|
chr12_+_119900931
|
0.861
|
NM_000545
|
HNF1A
|
HNF1 homeobox A
|
|
chr11_-_17147863
|
0.856
|
NM_002645
|
PIK3C2A
|
phosphoinositide-3-kinase, class 2, alpha polypeptide
|
|
chr15_+_22781292
|
0.856
|
|
PAR5
|
Prader-Willi/Angelman syndrome-5
|
|
chr4_+_120167264
|
0.854
|
|
SYNPO2
|
synaptopodin 2
|
|
chr3_-_71196696
|
0.850
|
|
FOXP1
|
forkhead box P1
|
|
chr10_+_24795465
|
0.850
|
|
KIAA1217
|
KIAA1217
|
|
chr1_-_60164912
|
0.844
|
NM_000775
|
CYP2J2
|
cytochrome P450, family 2, subfamily J, polypeptide 2
|
|
chr17_+_69939130
|
0.844
|
NM_022036
|
GPRC5C
|
G protein-coupled receptor, family C, group 5, member C
|
|
chr2_-_133895795
|
0.837
|
|
NCKAP5
|
NCK-associated protein 5
|
|
chr1_-_159459999
|
0.835
|
NM_001643
|
APOA2
|
apolipoprotein A-II
|
|
chrX_-_6155887
|
0.831
|
NM_020742
|
NLGN4X
|
neuroligin 4, X-linked
|
|
chr6_+_127006298
|
0.830
|
|
LOC728666
|
PRELI domain containing 1 pseudogene
|
|
chr6_-_56824371
|
0.826
|
|
DST
|
dystonin
|
|
chr14_-_73620826
|
0.819
|
|
ALDH6A1
|
aldehyde dehydrogenase 6 family, member A1
|
|
chr12_+_12656109
|
0.815
|
|
CREBL2
|
cAMP responsive element binding protein-like 2
|
|
chr12_+_12656022
|
0.814
|
NM_001310
|
CREBL2
|
cAMP responsive element binding protein-like 2
|
|
chr11_+_101488380
|
0.812
|
NM_001195045
|
YAP1
|
Yes-associated protein 1
|
|
chr14_-_20563722
|
0.810
|
NM_016250
NM_201535
NM_201536
NM_201537
|
NDRG2
|
NDRG family member 2
|
|
chr2_-_97775300
|
0.803
|
|
TMEM131
|
transmembrane protein 131
|
|
chr2_-_188086612
|
0.799
|
|
TFPI
|
tissue factor pathway inhibitor (lipoprotein-associated coagulation inhibitor)
|
|
chr12_+_99391681
|
0.794
|
NM_005123
|
NR1H4
|
nuclear receptor subfamily 1, group H, member 4
|
|
chr14_-_20563698
|
0.786
|
|
NDRG2
|
NDRG family member 2
|
|
chr12_+_32578513
|
0.779
|
|
FGD4
|
FYVE, RhoGEF and PH domain containing 4
|
|
chr2_-_65447370
|
0.779
|
NM_001128210
|
SPRED2
|
sprouty-related, EVH1 domain containing 2
|
|
chr7_+_94377145
|
0.774
|
NM_001166161
NM_001166162
NM_001166163
|
PPP1R9A
|
protein phosphatase 1, regulatory (inhibitor) subunit 9A
|
|
chr5_-_42847716
|
0.762
|
NM_001085486
NM_001093726
NM_005410
|
SEPP1
|
selenoprotein P, plasma, 1
|
|
chr5_+_78568094
|
0.760
|
|
|
|
|
chr20_+_2030527
|
0.756
|
NM_080836
|
STK35
|
serine/threonine kinase 35
|
|
chr13_-_98708549
|
0.752
|
NM_001098200
NM_005292
|
GPR18
|
G protein-coupled receptor 18
|
|
chr9_-_93163965
|
0.751
|
|
AUH
|
AU RNA binding protein/enoyl-CoA hydratase
|
|
chr12_+_105220638
|
0.750
|
NM_152772
|
TCP11L2
|
t-complex 11 (mouse)-like 2
|
|
chr10_-_92671005
|
0.743
|
NM_014391
|
ANKRD1
|
ankyrin repeat domain 1 (cardiac muscle)
|
|
chr14_+_23653745
|
0.742
|
NM_001163484
|
DCAF11
|
DDB1 and CUL4 associated factor 11
|
|
chr10_+_63331018
|
0.741
|
NM_032199
|
ARID5B
|
AT rich interactive domain 5B (MRF1-like)
|
|
chr2_-_65447267
|
0.736
|
|
SPRED2
|
sprouty-related, EVH1 domain containing 2
|
|
chr12_+_13240868
|
0.735
|
NM_001423
|
EMP1
|
epithelial membrane protein 1
|
|
chr7_-_87180499
|
0.734
|
NM_000927
|
ABCB1
|
ATP-binding cassette, sub-family B (MDR/TAP), member 1
|
|
chr2_-_174968595
|
0.730
|
NM_004882
|
CIR1
|
corepressor interacting with RBPJ, 1
|
|
chr14_+_23653848
|
0.729
|
|
DCAF11
|
DDB1 and CUL4 associated factor 11
|
|
chr12_-_9159789
|
0.723
|
NM_000014
|
A2M
|
alpha-2-macroglobulin
|
|
chr19_-_7244876
|
0.721
|
NM_000208
NM_001079817
|
INSR
|
insulin receptor
|
|
chr10_+_111959978
|
0.721
|
NM_001008541
|
MXI1
|
MAX interactor 1
|
|
chr10_-_52315436
|
0.717
|
NM_001198818
NM_001198819
NM_001198820
NM_014576
NM_138932
NM_138933
|
A1CF
|
APOBEC1 complementation factor
|
|
chr1_-_24342158
|
0.717
|
NM_021258
|
IL22RA1
|
interleukin 22 receptor, alpha 1
|
|
chr17_+_2627099
|
0.710
|
|
RAP1GAP2
|
RAP1 GTPase activating protein 2
|
|
chr12_+_13240987
|
0.692
|
|
EMP1
|
epithelial membrane protein 1
|
|
chr6_-_109521969
|
0.690
|
NM_014454
|
SESN1
|
sestrin 1
|
|
chr9_-_88087192
|
0.688
|
NM_030940
|
ISCA1
|
iron-sulfur cluster assembly 1 homolog (S. cerevisiae)
|
|
chr3_-_187309442
|
0.683
|
NM_004454
|
ETV5
|
ets variant 5
|
|
chr8_-_119192985
|
0.681
|
NM_000127
|
EXT1
|
exostosin 1
|
|
chr3_-_150903749
|
0.677
|
NM_001168278
|
WWTR1
|
WW domain containing transcription regulator 1
|
|
chr14_+_23653819
|
0.677
|
NM_025230
|
DCAF11
|
DDB1 and CUL4 associated factor 11
|
|
chr1_-_92124064
|
0.677
|
|
TGFBR3
|
transforming growth factor, beta receptor III
|
|
chr20_+_2792688
|
0.676
|
NM_002836
|
PTPRA
VPS16
|
protein tyrosine phosphatase, receptor type, A
vacuolar protein sorting 16 homolog (S. cerevisiae)
|
|
chr20_-_42584100
|
0.675
|
NM_006811
NM_198941
|
SERINC3
|
serine incorporator 3
|
|
chr6_+_139136349
|
0.672
|
NM_015439
|
CCDC28A
|
coiled-coil domain containing 28A
|
|
chr4_-_111339201
|
0.672
|
NM_001130721
NM_024090
|
ELOVL6
|
ELOVL family member 6, elongation of long chain fatty acids (FEN1/Elo2, SUR4/Elo3-like, yeast)
|
|
chr5_-_142045770
|
0.672
|
NM_000800
|
FGF1
|
fibroblast growth factor 1 (acidic)
|
|
chr19_+_46416975
|
0.666
|
|
AXL
|
AXL receptor tyrosine kinase
|
|
chr16_-_56389176
|
0.666
|
NM_001130099
|
KIFC3
|
kinesin family member C3
|
|
chr19_+_46416971
|
0.665
|
|
AXL
|
AXL receptor tyrosine kinase
|
|
chr1_+_33494745
|
0.663
|
NM_152493
|
ZNF362
|
zinc finger protein 362
|
|
chr17_+_35472566
|
0.661
|
NM_001190918
NM_003250
NM_199334
|
THRA
|
thyroid hormone receptor, alpha (erythroblastic leukemia viral (v-erb-a) oncogene homolog, avian)
|
|
chr19_+_46417099
|
0.660
|
|
AXL
|
AXL receptor tyrosine kinase
|
|
chr19_+_1158129
|
0.660
|
|
EFNA2
|
ephrin-A2
|
|
chr13_-_40138607
|
0.654
|
NM_002015
|
FOXO1
|
forkhead box O1
|
|
chr9_-_93164015
|
0.653
|
NM_001698
|
AUH
|
AU RNA binding protein/enoyl-CoA hydratase
|
|
chr17_+_38916895
|
0.651
|
|
DHX8
|
DEAH (Asp-Glu-Ala-His) box polypeptide 8
|
|
chr17_-_6958695
|
0.648
|
|
ASGR2
|
asialoglycoprotein receptor 2
|
|
chr15_-_75135496
|
0.645
|
|
TSPAN3
|
tetraspanin 3
|
|
chr20_-_33705244
|
0.643
|
NM_003915
|
CPNE1
|
copine I
|
|
chr10_+_111975618
|
0.642
|
NM_005962
|
MXI1
|
MAX interactor 1
|
|
chr3_-_12916547
|
0.632
|
|
IQSEC1
|
IQ motif and Sec7 domain 1
|
|
chr18_-_53438854
|
0.629
|
|
|
|
|
chr5_-_142046175
|
0.628
|
NM_033136
|
FGF1
|
fibroblast growth factor 1 (acidic)
|
|
chr11_+_20005704
|
0.627
|
|
NAV2
|
neuron navigator 2
|
|
chr12_-_110410730
|
0.619
|
|
ATXN2
|
ataxin 2
|
|
chr2_-_188127294
|
0.619
|
|
TFPI
|
tissue factor pathway inhibitor (lipoprotein-associated coagulation inhibitor)
|
|
chr7_+_116151411
|
0.618
|
|
MET
|
met proto-oncogene (hepatocyte growth factor receptor)
|
|
chr3_-_95175282
|
0.617
|
|
PROS1
|
protein S (alpha)
|
|
chr2_-_188127430
|
0.616
|
NM_001032281
NM_006287
|
TFPI
|
tissue factor pathway inhibitor (lipoprotein-associated coagulation inhibitor)
|
|
chr2_+_101680594
|
0.615
|
NM_004834
NM_145686
NM_145687
|
MAP4K4
|
mitogen-activated protein kinase kinase kinase kinase 4
|
|
chr4_+_124537334
|
0.613
|
NM_199327
|
SPRY1
|
sprouty homolog 1, antagonist of FGF signaling (Drosophila)
|
|
chr17_+_54763689
|
0.611
|
NM_001005404
|
YPEL2
|
yippee-like 2 (Drosophila)
|
|
chr9_-_14900992
|
0.608
|
NM_144966
|
FREM1
|
FRAS1 related extracellular matrix 1
|
|
chr2_+_198089036
|
0.603
|
|
MOBKL3
|
MOB1, Mps One Binder kinase activator-like 3 (yeast)
|
|
chr1_-_60165049
|
0.602
|
|
CYP2J2
|
cytochrome P450, family 2, subfamily J, polypeptide 2
|
|
chr15_-_68128924
|
0.596
|
|
TLE3
|
transducin-like enhancer of split 3 (E(sp1) homolog, Drosophila)
|
|
chr20_-_45410033
|
0.594
|
|
ZMYND8
|
zinc finger, MYND-type containing 8
|
|
chr8_+_31616809
|
0.593
|
NM_013962
|
NRG1
|
neuregulin 1
|
|
chr14_-_73620912
|
0.592
|
NM_005589
|
ALDH6A1
|
aldehyde dehydrogenase 6 family, member A1
|
|
chr1_+_149877955
|
0.592
|
|
SNX27
|
sorting nexin family member 27
|
|
chr14_-_34414603
|
0.591
|
NM_013448
NM_182648
|
BAZ1A
|
bromodomain adjacent to zinc finger domain, 1A
|
|
chr21_-_34820916
|
0.581
|
NM_203418
|
RCAN1
|
regulator of calcineurin 1
|
|
chr10_-_92670764
|
0.578
|
|
ANKRD1
|
ankyrin repeat domain 1 (cardiac muscle)
|
|
chr13_-_109600709
|
0.576
|
|
COL4A1
|
collagen, type IV, alpha 1
|
|
chr5_+_86712376
|
0.573
|
|
|
|
|
chr9_-_134809774
|
0.573
|
|
TSC1
|
tuberous sclerosis 1
|
|
chr6_+_64414389
|
0.573
|
NM_015153
|
PHF3
|
PHD finger protein 3
|
|
chr8_-_134378630
|
0.572
|
NM_001135242
NM_006096
|
NDRG1
|
N-myc downstream regulated 1
|
|
chr6_+_155579788
|
0.571
|
NM_001010927
|
TIAM2
|
T-cell lymphoma invasion and metastasis 2
|
|
chr10_-_54201400
|
0.568
|
NM_000242
|
MBL2
|
mannose-binding lectin (protein C) 2, soluble
|
|
chr2_+_111594921
|
0.567
|
NM_006538
NM_138621
NM_207002
|
BCL2L11
|
BCL2-like 11 (apoptosis facilitator)
|
|
chr2_-_160181206
|
0.565
|
NM_013450
|
BAZ2B
|
bromodomain adjacent to zinc finger domain, 2B
|
|
chr11_-_62070775
|
0.564
|
|
AHNAK
|
AHNAK nucleoprotein
|
|
chr2_+_86800940
|
0.563
|
|
RMND5A
|
required for meiotic nuclear division 5 homolog A (S. cerevisiae)
|
|
chr6_-_56824672
|
0.558
|
|
DST
|
dystonin
|
|
chr2_+_86800898
|
0.558
|
NM_022780
|
RMND5A
|
required for meiotic nuclear division 5 homolog A (S. cerevisiae)
|
|
chr12_+_13240983
|
0.555
|
|
EMP1
|
epithelial membrane protein 1
|
|
chr17_+_38247493
|
0.555
|
|
PSME3
|
proteasome (prosome, macropain) activator subunit 3 (PA28 gamma; Ki)
|
|
chr17_+_38916758
|
0.554
|
NM_004941
|
DHX8
|
DEAH (Asp-Glu-Ala-His) box polypeptide 8
|
|
chr16_-_30014993
|
0.553
|
NM_031477
NM_001145524
|
YPEL3
|
yippee-like 3 (Drosophila)
|
|
chr20_-_33783409
|
0.551
|
|
RBM39
|
RNA binding motif protein 39
|
|
chr2_-_87156616
|
0.545
|
|
LOC285074
|
anaphase promoting complex subunit 1 pseudogene
|
|
chr2_-_180319013
|
0.544
|
NM_001113397
|
ZNF385B
|
zinc finger protein 385B
|
|
chr2_-_165259334
|
0.544
|
|
COBLL1
|
COBL-like 1
|
|
chr2_+_86801081
|
0.543
|
|
RMND5A
|
required for meiotic nuclear division 5 homolog A (S. cerevisiae)
|
|
chr7_-_50596238
|
0.537
|
NM_000790
|
DDC
|
dopa decarboxylase (aromatic L-amino acid decarboxylase)
|
|
chr15_+_22832198
|
0.531
|
|
SNRPN
|
small nuclear ribonucleoprotein polypeptide N
|
|
chr20_+_2031418
|
0.531
|
|
STK35
|
serine/threonine kinase 35
|
|
chr10_+_102782156
|
0.530
|
|
SFXN3
|
sideroflexin 3
|
|
chr10_+_123738678
|
0.528
|
NM_206861
NM_206862
|
TACC2
|
transforming, acidic coiled-coil containing protein 2
|
|
chr16_+_82540172
|
0.526
|
NM_013370
NM_182980
|
OSGIN1
|
oxidative stress induced growth inhibitor 1
|
|
chr3_-_79899748
|
0.522
|
NM_002941
|
ROBO1
|
roundabout, axon guidance receptor, homolog 1 (Drosophila)
|
|
chr12_-_74711642
|
0.519
|
NM_007350
|
PHLDA1
|
pleckstrin homology-like domain, family A, member 1
|
|
chr1_-_167822248
|
0.515
|
|
F5
|
coagulation factor V (proaccelerin, labile factor)
|
|
chr11_-_46572160
|
0.509
|
|
AMBRA1
|
autophagy/beclin-1 regulator 1
|
|
chr15_+_78520634
|
0.508
|
|
ARNT2
|
aryl-hydrocarbon receptor nuclear translocator 2
|
|
chr16_+_24709922
|
0.507
|
|
TNRC6A
|
trinucleotide repeat containing 6A
|
|
chr6_+_32230172
|
0.505
|
|
PPT2
|
palmitoyl-protein thioesterase 2
|
|
chr15_-_58671929
|
0.500
|
NM_134262
|
RORA
|
RAR-related orphan receptor A
|
|
chr10_+_31650069
|
0.497
|
NM_001128128
NM_001174094
|
ZEB1
|
zinc finger E-box binding homeobox 1
|
|
chr9_-_134809816
|
0.497
|
NM_000368
NM_001162426
NM_001162427
|
TSC1
|
tuberous sclerosis 1
|
|
chr1_+_109043550
|
0.495
|
|
PRPF38B
|
PRP38 pre-mRNA processing factor 38 (yeast) domain containing B
|
|
chr17_-_62671738
|
0.493
|
|
HELZ
|
helicase with zinc finger
|
|
chr5_+_72287630
|
0.493
|
|
FCHO2
|
FCH domain only 2
|
|
chr2_-_20375497
|
0.491
|
|
PUM2
|
pumilio homolog 2 (Drosophila)
|
|
chr14_-_93859394
|
0.491
|
NM_001756
|
SERPINA6
|
serpin peptidase inhibitor, clade A (alpha-1 antiproteinase, antitrypsin), member 6
|
|
chr10_-_118670968
|
0.489
|
|
KIAA1598
|
KIAA1598
|
|
chr2_+_11591692
|
0.485
|
NM_014668
|
GREB1
|
growth regulation by estrogen in breast cancer 1
|
|
chr16_-_46957254
|
0.481
|
|
SIAH1
|
seven in absentia homolog 1 (Drosophila)
|
|
chr20_+_35266581
|
0.480
|
|
RPN2
|
ribophorin II
|
|
chr3_+_23961739
|
0.477
|
NM_005126
|
NR1D2
|
nuclear receptor subfamily 1, group D, member 2
|
|
chr9_+_117955890
|
0.474
|
NM_002581
|
PAPPA
|
pregnancy-associated plasma protein A, pappalysin 1
|
|
chr1_-_167822334
|
0.472
|
NM_000130
|
F5
|
coagulation factor V (proaccelerin, labile factor)
|
|
chr11_+_22652957
|
0.470
|
|
GAS2
|
growth arrest-specific 2
|
|
chr4_+_140806371
|
0.467
|
NM_002413
|
MGST2
|
microsomal glutathione S-transferase 2
|
|
chr3_+_38322430
|
0.462
|
NM_004803
|
SLC22A14
|
solute carrier family 22, member 14
|
|
chr11_+_73037382
|
0.461
|
NM_001130036
|
PLEKHB1
|
pleckstrin homology domain containing, family B (evectins) member 1
|
|
chr17_-_36719030
|
0.460
|
NM_001146182
|
KRTAP16-1
|
keratin associated protein 16-1
|
|
chr1_-_27113018
|
0.459
|
NM_021969
|
NR0B2
|
nuclear receptor subfamily 0, group B, member 2
|